
I have been absent from posting here for quite a while. It is nice to be busy, but that sometimes means that I neglect other things that I really should do.
Today I ran across some material developed by Pierre-Antoine Kremp who is doing work on forecasting the outcome of the 2016 election. It is interesting analytical work based on Bayesian probability models, and is available on Slate. See http://www.slate.com/features/pkremp_forecast/report.html for the details.
What I wanted to show you was this chart where he plots the predicted probabilities, by state, for the candidates. I may use something like this to present the results of propensity modeling.
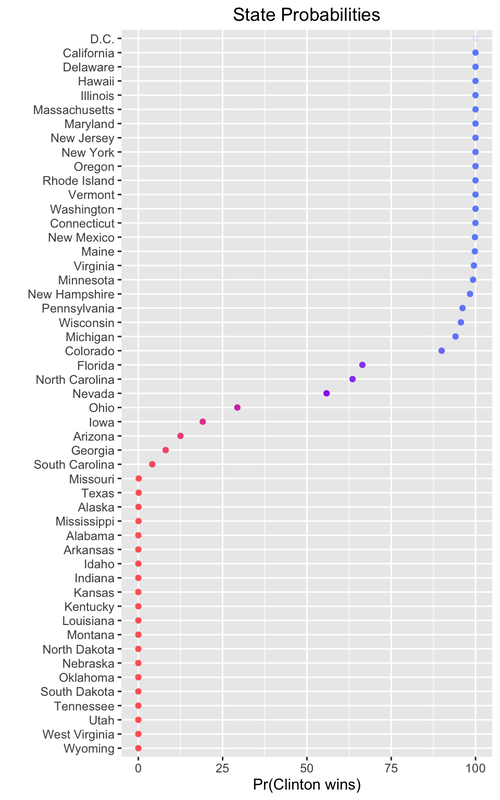
This graph really does illustrate how few states really are "in play" for this election.
 RSS Feed